
Radiotelescope theory (Work in progress)
This tutorial provides a detailed guide on conducting radio observations using an RTL-SDR (Software Defined Radio) receiver.
Introduction
The RTL-SDR is a compact USB-based radio receiver that interfaces with a computer. In this setup, an Orange Pi—an affordable alternative to the Raspberry Pi—is used as the host system.To begin, download the
rtl-sdr library from Github and extract it into the /home directory on your Pi.
Follow the instructions provided on Osmocom website to install the library.Next, you'll need the FFTW3 library, which facilitates Fast Fourier Transform operations. Download it from FFTW official website. Extract it to the
/home folder on your Pi.
Process overview
This section provides a process overview and mathematical equations.

1. Data acquisition:
The RTL-SDR captures data in the form of I-Q (In-phase and Quadrature) samples, representing the amplitude and phase of the received signal over time. This is referred to as time-domain data.
1. Frequency domain conversion:
To analyze the frequency components of the signal, convert the time-domain data to frequency-domain data using the Fast Fourier Transform (FFT). Specifically, the Discrete Fourier Transform (DFT) is applied. The number of samples (N) used in the FFT should be a power of 2; in this example, N = 1024. The FFT output is a complex array representing the amplitude and phase of frequency components.
I won’t go into detail about how FFT works, but you can read more about it in this paper.
3. Power Spectral Density (PSD) Calculation:
Compute the Power Spectral Density to quantify the power present at each frequency bin. The PSD is calculated using the equation:
$$PSD[i] = \frac{(Re(X[i]))^2 + (Im(X[i]))^2}{f_s \cdot w_s}$$
WhereRe(X) is the real component of the complex FFT output, Im(X) is the imaginary component, f_s is the sampling frequency, and w_s is the sum of the window function applied to the data to reduce spectral leakage.$$w_s=\sum_{n=1}^{N}(1-cos(\frac{2 \pi n} {N-1}))$$
By doing this for each sample in the array, we calculate the power received from each frequency bin in the FFT output. The units at this point are in W/Hz. 4. Conversion to decibels:Convert the PSD values from watts per hertz (W/Hz) to decibels per hertz (dB/Hz) using:
PSD[i] = 10 * log10(PSD[i])5. Light and dark frames:
We perform this process twice: once for the light frame—the one taken at 1420.4 MHz—and once for the dark frame—taken at a slightly offset frequency, for example, 1418 MHz. Why? Because when you get data from the SDR, the signal intensity is not flat across all received frequencies. The bandpass filter of the SDR distorts it. Below is an example of a light and a dark frame:


6. Signal extraction:
Subtract the dark frame from the light frame to isolate the hydrogen line signal. This differential approach mitigates the effects of the SDR's frequency response and other systematic biases.

7. Total power calculation:
We can then calculate the total power received in the signal using the following equation:
$$P_{tot} = \sum_{n=1}^{N}(PSD[n] * \Delta f)$$
Where $\Delta f$ is the FFT frequency bin width.This process provides a concise overview of data collection and processing. For more in-depth information, refer to the following sections:
Installing the RTL-SDR and FFTW3 libraries
Reading data from RTL-SDR
Fast Fourier Transform
Final data processing
This section provides examples of functions used for control and data acquisition from RTL-SDR.
RTL_SDR Initialization
First we must initialize the library, this is the short version of the initialization code, but it has all the functions you need to correctly configure SDR for work:
int configure_rtlsdr(){

	int device_count = rtlsdr_get_device_count();
	if (!device_count) {
		printf("No supported devices found.\n");
		exit(1);
	}

	for(int i = 0; i < device_count; i++){
		printf("#%d: %s\n", n, rtlsdr_get_device_name(i));
	}

	int dev_open = rtlsdr_open(&dev, _dev_id);

	if (dev_open < 0) {
		printf("Failed to open RTL-SDR device #%d\n", _dev_id);
		exit(1);
	}
	else
		printf("Using device: #%d\n", dev_open);

	rtlsdr_set_tuner_gain_mode(dev, 1);
	rtlsdr_set_tuner_gain(dev, gain);
	rtlsdr_set_bias_tee(dev,1);
	rtlsdr_set_offset_tuning(dev, _offset_tuning);
	rtlsdr_set_center_freq(dev, center_freq);
	rtlsdr_set_tuner_bandwidth(dev,bw);
	rtlsdr_set_sample_rate(dev, _samp_rate);

	int r = rtlsdr_reset_buffer(dev);
	if (r < 0){
		printf("Failed to reset buffers.\n");
		return 1;
	}
	return 0;
}
Fast Fourier Transform
This is an example of FFT using FFTW3 library.
//Variable declaration
#define N 1024
#define SAMPLE_NUM 2048
fftw_complex *in, *out;
fftw_plan p;
int rLen=0;
float fftAmpl[N]={0};
float psd[N]={0};

//Memmory allocation
in= (fftw_complex*)fftw_malloc(sizeof(fftw_complex)*N);
out= (fftw_complex*)fftw_malloc(sizeof(fftw_complex)*(N));
unsigned char *bufferRe= malloc (sizeof(unsigned char)*(N));
unsigned char *bufferIm= malloc (sizeof(unsigned char)*(N));

//Read data from RTL SDR,
rtlsdr_read_sync(dev, rec_data, SAMPLE_NUM, &rLen );

//Fill in[][] array with data.
//in[i][0] contains real parts
//in[i][1] contains imaginary parts

for(int i=0;i<N;i++){
	bufferRe[i]=rec_data[2*i+k*2*N];
	bufferIm[i]=rec_data[(2*i+1)+k*2*N];
}

for(int i=0;i<N;i++){
	in[i][0]=(bufferRe[i]-127.5)*(1-cos(2*M_PI*(i)/(N-1)));
	in[i][1]=(bufferIm[i]-127.5)*(1-cos(2*M_PI*(i)/(N-1)));
}

//Perform FFT
p = fftw_plan_dft_1d(N, in, out, FFTW_FORWARD, FFTW_ESTIMATE);
fftw_execute(p);

//Calculate FFT Amplitude
for(int i=0;i<N;i++){
	fftAmpl[i]=(out[i][0]*out[i][0]+out[i][1]*out[i][1]);
}

//Free allocated memory
fftw_destroy_plan(p);
fftw_cleanup();
fftw_free(in);
fftw_free(out);
free(bufferRe);
free(bufferIm);
After the FFT calculation is done, the results are stored in "out" array, with out[i][0] being real components, out[i][1] being imaginary components.
Before processing the output further, we must shift half of the frequencies in FFT result. The very good explanation why that's required can be read here .
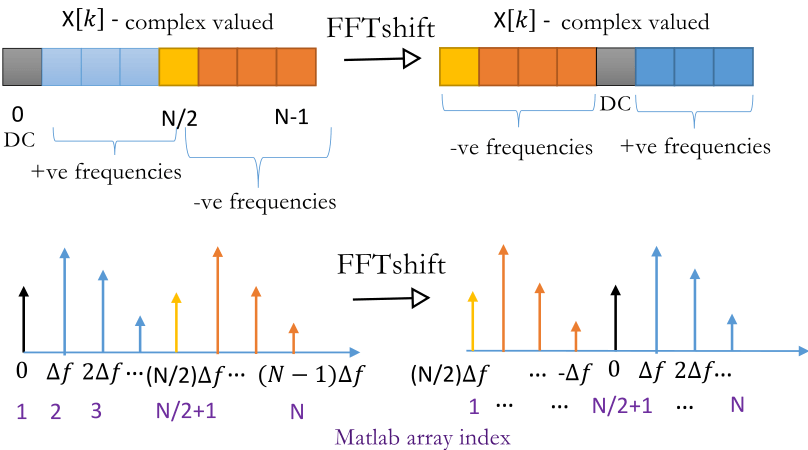
Code example for shifting the frequency bins
int j=0;

for (int i = N/2; i < N; i++){
	shiftedFreq[j]=fftAmpl[i];
	j+=1;
}

for (int i = 0; i < N/2; i++){
	shiftedFreq[j]=fftAmpl[i];
	j+=1;
}
We can calculate power spectral density now:
//Calculate window function sum
float window_f_sum=0;
for(int i=0;i<N;i++){

	window_f_sum+=(1-cos(2*M_PI*(i)/(N-1)))*(1-cos(2*M_PI*(i)/(N-1)));
}


//Calculate Power Spectral Density
for (int i=0;i<N;i++){
	psd[i]=(shiftedFreq[i]/(_samp_rate*window_f_sum));
}
Using these functions the result will be one short exposure "snapshot". To reduce the background noise you will need to do multiple FFT's and averag them together. The end result is a long exposure "snapshot" with much less noise and very visible hydrogen line.
Final data processing
The final data will almost never have background noise that is perfectly horizontal. In most cases, the noise will appear tilted due to slight variations in the SDR’s bandpass filter response across different frequencies. This needs to be corrected.
To do this, extract the data from two regions:
- From x=N/8 to x=N/4
- From x=N*3/4 to x=N*7/8
Now we can calculate the total noise power of the received signal.
Total signal power received
Total signal power received is calculated by multiplying frequency bin width by the value of the PSD at that coordinate. That is the area below PSD curve.
float binWidth=_samp_rate/N;
float noisePwr=0;

for (int i=0;i<N;i++){

	noisePwr+=(psd_corr2[i])*binWidth;
}
Total background noise power received
To get only the total power received by hydrogen line spectrum we need to subtract noise floor total power received. We do this by calculating total noise power in outer quarters of the graph (0-N/4) and (N*3/4-N) and multiplying it by 2 to account for the part of the noise that's under the hydrogen line.
for (int i=0;i<N/4;i++){

	noiseFloorSum+=(psd_corr2[i])*binWidth;
	*noiseFloor+=(psd_corr2[i]);
}

for (int i=3*N/4;i<N;i++){

	noiseFloorSum+=(psd_corr2[i])*binWidth;
	*noiseFloor+=(psd_corr2[i]);
}

noisePwr-=noiseFloorSum*2;
Copyright 2024-2025, Mario Matovina
Send me an e-mail